Market News
Latest Forex News
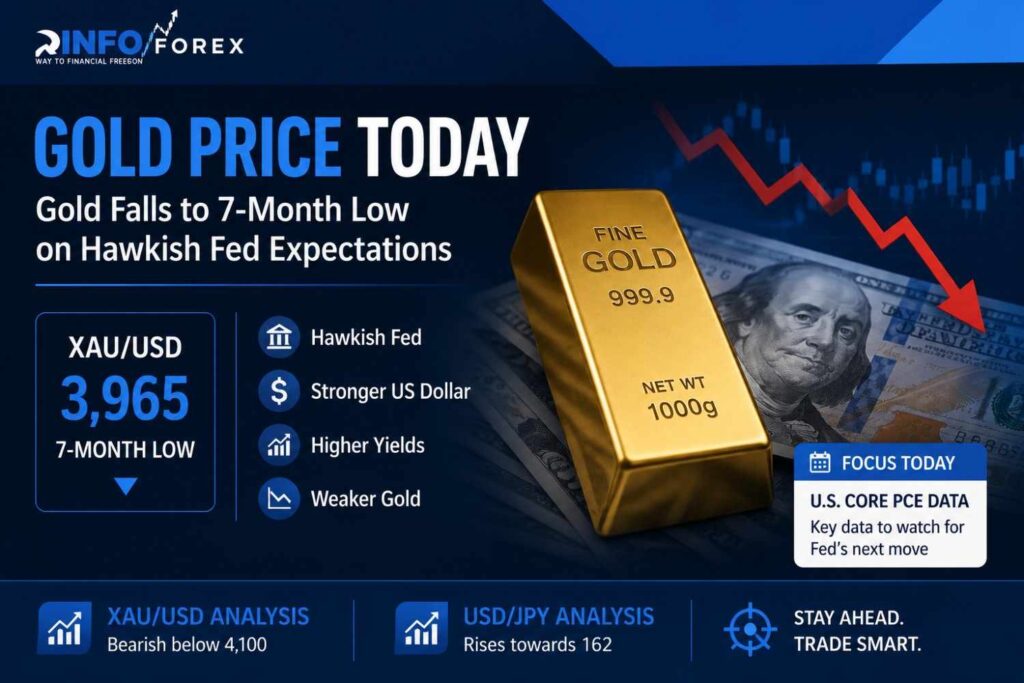
Gold prices (XAU/USD) recovered from their lowest level since November 2025 during Tuesday’s Asian session, moving higher as European trading began. Despite the bounce, the broader outlook remains cautious as a stronger US Dollar continues to weigh on the precious metal.
The US Dollar remains well supported after geopolitical developments in the Middle East and growing expectations that the Federal Reserve could keep interest rates higher for longer. Since gold does not generate interest, rising rate expectations often reduce its appeal compared with yield-bearing assets.
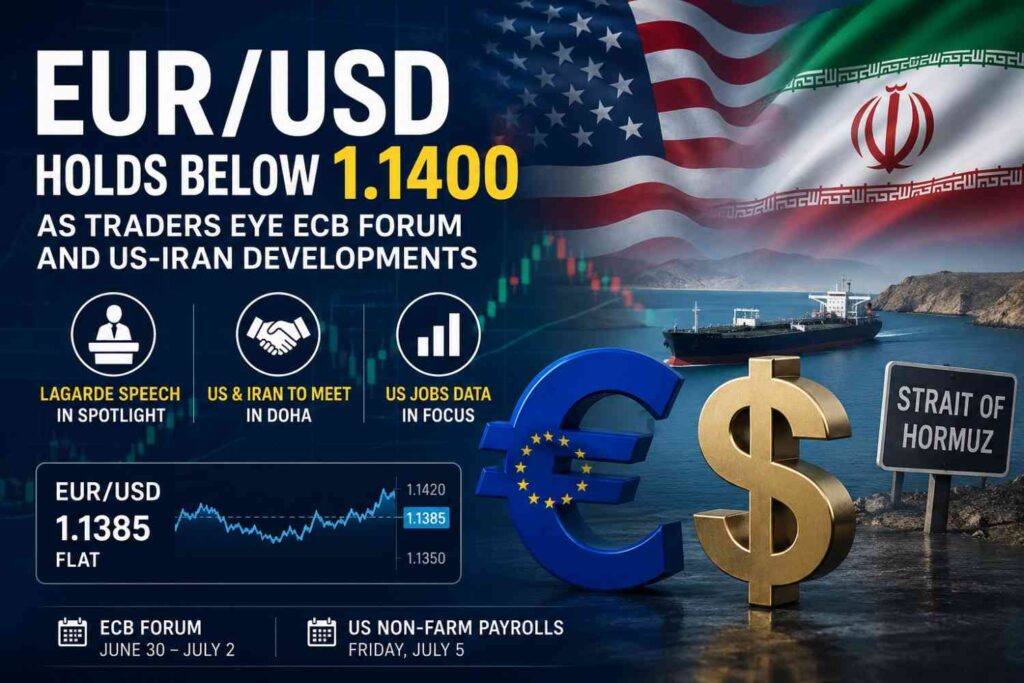
Reports indicated that the United States and Iran were working to reduce tensions after recent military exchanges near the Strait of Hormuz. US President Donald Trump also stated that Iran had requested a meeting in Doha, Qatar. However, Iranian officials denied that any formal technical discussions were scheduled this week. These mixed developments have kept investors alert, supporting demand for the US Dollar while limiting gold’s upside.
Markets also remain focused on inflation risks, which have increased following renewed tensions in the region. Combined with the Federal Reserve’s firm stance on monetary policy, investors continue to expect the possibility of additional rate hikes. Current market pricing suggests there is a strong chance of another rate increase later this year, helping maintain support for the US Dollar and reducing demand for non-yielding assets such as gold.
The Japanese Yen also weakened sharply against the US Dollar, reaching its lowest level in decades, adding further pressure across precious metal markets.
Investors are now watching several important US economic releases, including the Conference Board Consumer Confidence Index and the JOLTS Job Openings report. Later this week, attention will shift to Federal Reserve Chair Kevin Warsh’s speech at the European Central Bank Forum in Sintra, followed by the closely watched US Nonfarm Payrolls (NFP) report. These events could provide fresh direction for both the US Dollar and gold prices.
Technical Analysis
Gold remains under pressure despite Tuesday’s recovery. The price continues to trade below the key $4,000 level, keeping the short-term bearish trend intact. Previous attempts to move above the 100-period Simple Moving Average on the four-hour chart have repeatedly failed, reinforcing resistance in the higher price zone.
The MACD indicator remains slightly below the zero line, suggesting bearish momentum is easing but has not yet turned positive. Meanwhile, the Relative Strength Index (RSI) is hovering near oversold territory, indicating that selling pressure may be slowing, although there is still no confirmed signal of a bullish reversal.
On the upside, immediate resistance is seen around $4,045. A sustained move above this level could allow gold to retest the $4,100 area. However, stronger resistance is expected near the 100-period SMA around $4,180, where sellers may re-enter the market. A decisive break above that level would be needed to improve the overall technical outlook.
Until then, rallies are likely to face selling pressure, while the combination of a firm US Dollar and expectations of higher US interest rates continues to limit gold’s recovery.


Most Recent News
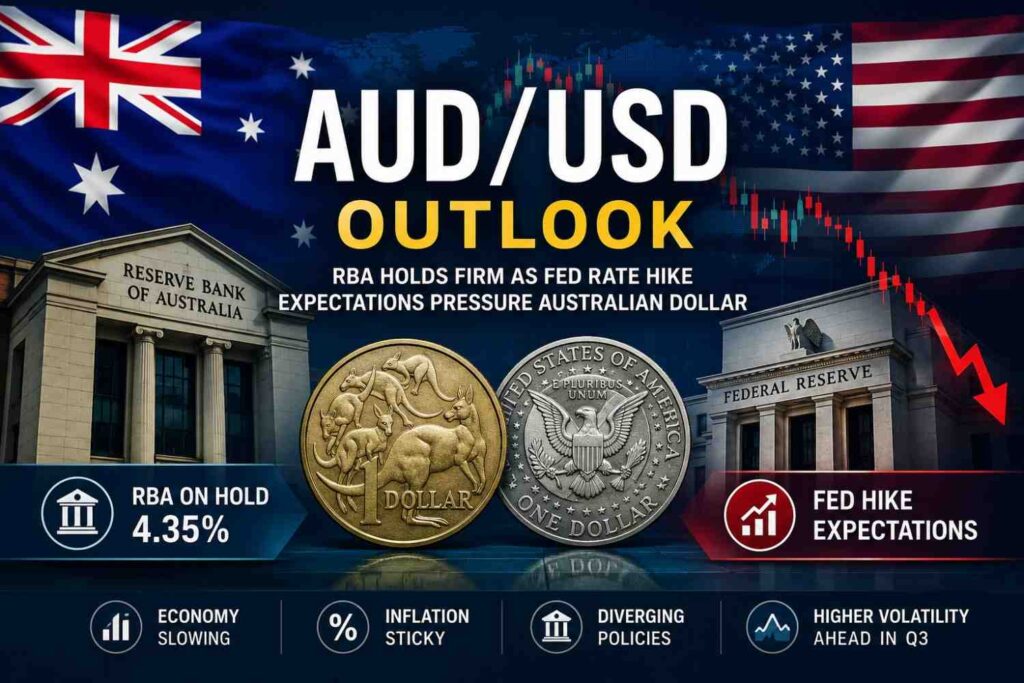
Today, the biggest movement in the forex market was seen from Australia and New Zealand news. Australia’s CPI inflation data came weaker than expected, where CPI m/m remained only 0.4% against the 0.6% forecast and yearly CPIe below forecast. After this weak inflation data, expectations in the market have increased that the RBA may avoid aggressive rate hikes in the future, due to which pressure is being seen on AUD. Traders are now expecting volatility in AUD/USD and AUD/JPY pairs.
On the other side, New Zealand’s central bank RBNZ kept the interest rate unchanged at 2.25%, but the real focus is now on their Monetary Policy Statement and Press Conference. If RBNZ keeps a hawkish tone regarding inflation or gives a signal to continue tight policy in the future, then a strong bullish move can come in NZD pairs. In today’s session, NZD/USD and AUD/NZD pairs will remain on traders’ radar, because during the press conference sharp spikes and fast reversals can be seen in the market.
AUD Sell Pressure, JPY Strong – What Should Traders Do Today?
Today, a clear sentiment is being seen in the market that traders are looking at the Australian Dollar on the sell side. After the weak CPI data, AUDUSD is trading under pressure around the 0.2396 zone, while NZDUSD is also looking weak near 0.5870. This means the market is currently pulling money out from risk currencies and shifting towards safe currencies. If AUDUSD becomes weaker intraday, then the next pressure zone for sellers can come on the downside, especially until strong price recovery is not seen.
On the other side, strength remains in Japanese Yen and Swiss Franc. USDJPY is trading above 159.33, which shows that the pair is in an overextended zone and a sharp reversal can also come at news time. For aggressive traders, the safest approach right now can be to wait for the news candle close instead of taking direct breakout entry. Gold is also stable around 3347, therefore if fear increases more in the market then both gold buying and JPY strength can continue.
What Should Traders Do Today?
In AUDUSD, sell-on-rise strategy is looking safer right now more than buy
Volatility can remain high in USDJPY, definitely use tight stop loss
Fast movement can come in NZD pairs after RBNZ comments
Gold traders should closely watch the 3347 support zone
At news time, the risk of fake breakouts and spread widening is high, therefore maintaining low lot size and proper risk management will remain important.
Global Macro & Geopolitical Market Update: Euro Area Focus + War Risk Impact
From today and tomorrow’s geopolitical and macro news, it is becoming clear that the euro area economy is now not only data-driven, but is also being heavily influenced by policy + global risk sentiment. In the Eurosystem’s discount rate meeting minutes (20 & 29 April 2026), policy direction and interest rate expectations were analyzed, which gives an important signal for future ECB stance. Along with this, the Eurosystem’s consolidated financial statement (22 May 2026) reflects banking system liquidity and balance sheet strength, which is a key factor for euro stability.
On the other side, the effect of EU-ETS prices on employment and the AI/deep learning solution approach in DSGE models shows that Europe is now in a structural transformation phase where inflation, carbon pricing, and employment have all become interconnected. The most important geopolitical driver right now is the impact of the Middle East war on euro area firms’ expectations, where EUR demand can come under pressure if risk sentiment weakens.
Simple Market View for Traders:
ECB-related minutes → EUR volatility trigger (policy expectation change)
Middle East conflict → Risk-off sentiment, EUR/USD downside pressure possible
EU-ETS + employment data → will decide medium-term EUR structural support or weakness
Overall, the market is now in a “data + geopolitics mix phase,” where not only indicators but also global risk news is directly deciding currency direction.

Today the global forex and commodities market is looking quite active, where on one side the US Dollar is maintaining its strength, while on the other side geopolitical tensions and central bank updates are continuously impacting market sentiment. Traders’ eyes are now focused on economic data, Fed expectations, BOJ policy signals and Middle East developments, because due to these factors strong volatility is being seen in currencies, gold and oil. The overall mood of the market is currently cautious, but short-term trading opportunities are continuously being created — especially in USD pairs, gold and crude oil.
Today’s Economic Calendar: Important Market Update for Forex Traders
Today’s economic calendar is looking quite important for forex traders because chances of increased volatility in the market are high. If US inflation, interest rate or employment data comes better than expected then USD can become strong, due to which selling pressure can be seen in EUR/USD and GBP/USD, while downside move can come in Gold. On the other side if the data remains weak then the dollar can become weak and bullish recovery can be seen in the market. At the time of such news events the market reacts very fast, therefore before taking entry it will be important to observe the price action.
From my side the simple advice for traders will be to avoid over-risk at the exact time of news release and do not enter trade without confirmation. Many times the market first gives a fake move and later catches the original trend. Therefore patience and proper risk management will remain most important today. If you do scalping or intraday trading then keep stop loss tight and avoid unnecessary emotional trades.
Dollar Dominance Continues — USD Bulls in Control in Forex Market
Today the mood of the forex market is looking quite “risk-off”. The Dollar is continuously showing strength, especially against yen and franc — USDJPY has reached very close to 159, which clearly shows that the market is still trusting the US economy and higher rates story. EURUSD and GBPUSD both are under pressure, and confidence among buyers is looking weak right now. On the other side AUD and NZD pairs have stability, but aggressive buying is not being seen in them either. On the crypto side the strongness of Bitcoin and Ethereum gives this signal that traders are not completely in defensive mode, rather they are taking selective risk. Overall market sentiment is saying this: “King dollar is still in control.” For short-term traders, buying on USD dips and cautious selling strategy on EUR/GBP rallies is looking safer, especially until any weak US data surprises the market.
Global Market Highlights: Dollar Weakness, Central Bank Signals & Breakout Zones
Mixed sentiment is being seen in the global forex market where due to hopes of Iran peace deal and reduction in Hormuz tensions temporary weakness has come in the US Dollar. This move gave support to EUR/USD and the euro started the week with strong momentum. USD/CAD rally also stopped at the key resistance zone because easing geopolitical fears supported the Canadian Dollar. On the other side AUD/USD is still under bearish pressure and traders are closely watching the psychologically important 0.70 level. In precious metals silver is making a tight consolidation range, which can trigger a strong breakout move at any time, while Nasdaq 100 is continuously trading near new all-time highs, reflecting continued optimism in tech and AI stocks.
From the side of central banks also important signals are coming to the market. BOJ’s new inflation trend gauge has indicated that inflation in Japan is now sustaining above the official target, due to which future BOJ tightening and possible rate hike expectations are increasing. Due to this development volatility can increase in yen-related pairs. Along with this ECB Survey of Monetary Analysts (SMA) has shown that Eurozone inflation is gradually cooling, but economic growth concerns are still remaining a challenge for policymakers. Overall traders are now closely monitoring not only geopolitical headlines but also the next policy signals of BOJ and ECB.
Commodities Update: Gold Under Pressure, Oil Jumps on Iran Tensions
Today strong volatility was seen in commodity markets as Middle East tensions again came into headlines. Gold prices first recovered due to Iran peace optimism, but then USD strength and possible Fed rate hike expectations put the precious metal under pressure. In India also gold prices are trading lower, which reflects the global bearish sentiment. Traders are now closely monitoring both safe-haven demand and dollar movement because geopolitical uncertainty has still not fully ended.
In the oil market WTI crude showed a strong rebound and prices reached near $91 after reports that US forces conducted self-defense strikes in southern Iran. Along with this US Secretary of State Marco Rubio gave a clear statement that the Strait of Hormuz will remain open “one way or the other”, which created further reaction in the energy market. Overall the commodities market is now under the direct impact of geopolitical headlines, where gold is in defensive mode while oil is holding bullish momentum due to supply risk fears.
Conclusion
If today’s market sentiment is observed then USD pairs are still looking the most active and tradable for traders, especially USDJPY and EURUSD. Due to dollar strength selling opportunities can be found in EUR/USD and GBP/USD until any weak US data reverses the market. Gold is currently under pressure and is looking risky without clear direction, therefore beginners should avoid overtrading in XAU/USD. The oil market is highly volatile due to geopolitical tensions, where experienced traders can look for short-term momentum trades. Overall the focus should remain on USD strength and news-based volatility, with proper risk management and patience.

Traders Focus on CAD Data as Major Markets Remain in Holiday Mode
The forex market may remain relatively slow today as bank holidays in the USD, GBP, EUR, and CHF markets are keeping major participants away from trading activity. This simply means that fewer institutional players will be active, trading volume is expected to stay low, and unnecessary choppy movements may appear in the market. On such days, breakout trades often fail, which is why traders should remain patient and avoid overtrading. Although the London and New York sessions are usually strong, their impact may remain limited today.
For CAD traders, the “Corporate Profits q/q” data scheduled for 6:00 PM will remain important. The previous reading came at -1.6%, reflecting weak corporate earnings. If today’s figures show improvement, the market may view it as positive for the Canadian economy, which could slightly strengthen the CAD and push USD/CAD lower. However, due to the holiday environment, any move may remain limited instead of becoming sharp, making entries without confirmation potentially risky.
USD Weak, Gold Strong — Smart Traders Stay Defensive in Holiday Market Conditions
Today’s market watch clearly indicates pressure on USD pairs. USDCHF is trading weak near 0.7818, while EURUSD at 1.1642 and GBPUSD at 1.3486 are showing slight buying momentum. The pair USDJPY is also moving lower towards 158.86, suggesting weakness in the US dollar on Wednesday. The major factor that is causing this weakness is the low liquidity due to the US bank holiday. USD/CAD is also showing weakness at 1.3807; however, CAD will watch the corporate profits at 6:00 PM. If the data comes in better than expected, further downside pressure may emerge in USD/CAD.
Interesting movement is also being observed in commodities and equities. Gold (XAU/USD) continues to hold above 3952, supporting safe-haven demand. At the same time, Apple near 308, Microsoft around 418, and Visa close to 328 are trading in the red zone, indicating that traders are avoiding aggressive buying in risk assets. Today’s market trend appears more “wait-and-watch” rather than a fast-trending session, which is why smart traders may prefer short targets and tight stop-loss strategies instead of heavy positional trades.
Gold Supported by Geopolitical Tensions, Traders Advised to Stay Alert
Fresh headlines related to the Russia-Ukraine conflict have turned market sentiment cautious. Ukraine reportedly intercepted 246 Russian drones overnight, while attacks and civilian damage were reported across multiple regions. Due to these tensions, safe-haven assets such as Gold and the CHF may continue to remain strong, especially while the market is already operating in a low-liquidity environment.
For traders today, the best approach may be to allow market reactions to confirm before taking quick entries after news releases. Sudden spikes are common during geopolitical trading days, which is why tight stop-losses and smaller lot sizes may remain the safer strategy.
Market Sentiment: Cautious to Slightly Risk-Off
The sentiment in the market currently seems to be on the cautious side. Low liquidity due to several bank holidays, USD pairs trading weaker, and Gold staying firm above 3950 indicate this. At the same time, fresh Russia-Ukraine conflict headlines are keeping traders in a defensive mood. In this environment, the market may deliver volatile and news-driven moves instead of clear fast trends, making patience and risk management more important for traders today.
Conclusion: A Cautious Trading Day Amid Low Liquidity and Geopolitical Risks
Today’s overall market environment remains clearly “risk-aware” and cautious. On one side, liquidity is extremely low because of bank holidays in the USD, GBP, EUR, and CHF markets, while on the other side, geopolitical tensions and weak USD sentiment are keeping the market unstable. Gold continues to hold strongly above 3950, confirming safe-haven demand, while major forex pairs are showing choppy and reaction-based movements instead of clear trends. The CAD Corporate Profits data will remain today’s key trigger, although the overall market flow is still likely to stay limited.
In this type of market, the most important factor for traders is to avoid overtrading, avoid chasing news-driven spikes, and only take entries after confirmation. Today’s session is more about capital protection and disciplined execution rather than chasing fast profits, where patience may prove to be the strongest strategy.

Today in forex market AUD remained under pressure after weak employment data, while EUR PMI data remained mixed where manufacturing was somewhat strong but services were weak. Due to geopolitical tensions and Fed’s hawkish tone, USD and JPY received support, resulting in overall risk-off sentiment in the market. Gold and NZD also remained under pressure, while traders are currently focusing on central bank cues and the US session.
Pressure on Australian Dollar, Euro PMI Data Remained Mixed
In today’s economic calendar, the main focus was on AUD red folder data. Australia’s Employment Change came at -18.6K while the forecast was +16.7K, which shows weakness in the labor market. At the same time, the Unemployment Rate increased to 4.5%, while expected was 4.3%. Both of these figures are negative signals for the Australian Dollar, so in the short term selling pressure can be seen on AUD pairs like AUD/USD and AUD/JPY. The market may also price in a softer stance for RBA’s future rate policy.
On the other hand, on the EUR side, orange folder PMI data remained mixed. French and German Manufacturing PMI stayed above 50, showing slight expansion in the manufacturing sector, but Services PMI is still below 50 which indicates weakness in the services sector. Due to this mixed data, strong bullish momentum did not build in the Euro, but because of manufacturing support downside in EUR may remain limited. Overall today market sentiment against AUD can remain bearish and in EUR neutral to slightly positive, especially if US session dollar strength continues.
Forex Market Movement: AUD Weakened, Yen Captured the Market
Today in forex market AUD remained among the weakest currencies where AUD/USD slipped to 0.71189, while AUD/JPY was seen trading at 113.213. After weak Australian employment data, traders continued AUD selling. On the other hand strength was seen in Japanese Yen, due to which USD/JPY and GBP/JPY remained under pressure at 159.016 and 213.546. On the Euro side EUR/USD remained stable in a bullish tone at 1.16192, while EUR/JPY traded at 184.776. Pound also remained relatively strong and GBP/USD moved around 1.34293 level. Overall market risk-off sentiment dominated where investors moved towards safer currencies after weak economic data.
Geopolitical Tensions Keep Forex Market Cautious
Today geopolitical tensions also heavily impacted forex market sentiment. Due to Iran-related uncertainty and Middle East risks, investors were seen moving towards safe-haven assets, which supported US Dollar and Japanese Yen. Due to hawkish Federal Reserve comments, Gold prices remained under pressure and EUR/USD was seen consolidating above 1.1600. Swiss Franc also remained weak against Dollar strength, while New Zealand Dollar despite stronger trade balance data remained under downside pressure. On the European side ECB officials signaled future rate hikes due to inflation risks, but traders are still closely monitoring geopolitical developments and possible central bank interventions.
Market Sentiment: Strong Demand for Dollar and Yen, Traders in Defensive Mode
Today the whole forex market was seen in a defensive mood. Due to Iran tensions and Fed hawkish stance, traders started moving away from risky currencies, which is why strong buying was seen in USD and JPY. USD/JPY traded around 159.016 while EUR/USD consolidated in a limited range at 1.16192. AUD was already under pressure due to weak jobs data and AUD/USD moved down to 0.71189. Gold also, despite normally being a safe-haven, slipped due to strong Dollar. ECB officials’ rate hike comments tried to support Euro, but the main focus of the market is still on geopolitical uncertainty and possible central bank reactions.
Central Bank Update: Fed Hawkish, BoE Cautious and BoJ Focused on Inflation
Yesterday’s central bank updates had a strong influence on the forex market. Federal Reserve FOMC minutes and officials’ comments signaled that the Fed is still cautious and maintaining a relatively hawkish stance regarding inflation, which supported the US Dollar. On the Bank of England side policymakers clarified that an immediate June or July rate cut is not necessary, but future easing is also not completely rejected, which is why GBP/USD could not build strong momentum and traded flat around 1.34293. On the other hand Bank of Japan’s Koeda said that core inflation is already near 2% and managing inflation through monetary policy is appropriate. After these comments traders supported the Yen, which created pressure on USD/JPY. Overall in the market central banks’ focus is still centered on inflation and geopolitical risks.
| Note: |
|---|
| This content is for educational and informational purposes only. The views given here are not financial advice. Forex trading involves risk, so before taking any trade, do your own research or consult a financial advisor. Responsibility for profit and loss lies solely with the trader. |

In today’s forex trading market, pressure was seen on GBP when UK CPI y/y data was released at 3.0%, which was lower than the market expectation of 3.3%. After weaker-than-expected inflation data, traders now believe that the Bank of England may not maintain as aggressive a stance on interest rates as before. After this update, volatility increased in GBP pairs, and short-term movements have become important for traders.
In the economic calendar today, the USD is also in focus as traders are waiting for the FOMC Meeting Minutes. The market expects that the Federal Reserve may give new hints regarding inflation and future rate policy. Along with this, upcoming BoE Monetary Policy Report Hearings can also become a major trigger for GBP. If BoE officials give hawkish comments, then recovery and sharp moves in the Pound may be seen, which is being closely watched by the forex trading community.
Central Bank Watch: What Was Important in the Forex Trading Market Today?
Fed: Market Is Now Waiting for the Next Policy Signal
The Federal Reserve has asked for public feedback regarding the financial institutions’ rating system, which shows that the Fed is now reviewing financial stability and the banking sector more closely. In the forex trading market, traders are now focused on whether the Fed will keep its stance more strict in future meetings or move towards rate cuts.
ECB: Major Discussions on Inflation and Economy
The ECB’s International Research Forum on Monetary Policy is an important event for the market today. In this forum, policymakers are sharing their views on inflation, economic slowdown, and future interest rates. Euro traders are especially closely tracking ECB comments as they can cause sharp movements in EUR pairs.
BoE: Weak UK CPI Puts Pressure on the Pound
The UK’s latest CPI y/y data came in at 3.0%, while the market forecast was 3.3%. After lower-than-expected inflation data, pressure was seen on the Pound because traders feel that the Bank of England may not continue aggressive rate hikes. Now the market’s focus is on upcoming BoE hearings and officials’ comments.
BoJ: Ueda Issues Warning Regarding Bond Market
Bank of Japan Governor Kazuo Ueda said that long-term bond yields in Japan are rising quite rapidly and the BOJ is closely monitoring the situation. He also mentioned that rising energy prices and Middle East tensions can impact inflation and the economy. After this statement, the chances of volatility in JPY pairs have increased further.
EUR/USD: Euro Remained Sideways, Traders Waiting for Fed
Today, EUR/USD was seen trading calmly around 1.1639. There was no aggressive buying in the market as traders are directly waiting for Fed updates and FOMC Minutes. Discussions on inflation and the economy are ongoing in the ECB forum, but the market has not yet received a strong bullish trigger.
GBP/USD: Pound Showed Recovery Despite Weak CPI
Normally, when CPI comes below the forecast, the Pound weakens, but today, interestingly, GBP/USD remained strong up to 1.3410. This means the market is not reacting only to CPI numbers, but traders believe that the BoE will still not take inflation lightly. Because of this, Pound buyers were active in the London session, and good movement was seen in GBP pairs.
USD/JPY: Yen Became Weak, Buyers Pushed Level to 159
USD/JPY again showed strong bullish momentum today, and the pair traded above 159.02. BOJ Governor Kazuo Ueda did mention bond yields and inflation pressure, but the market still believes that the Bank of Japan will remain slow in policy tightening. Because of this expectation, traders are not aggressively buying yen, and USD/JPY remains on the upside.
USD Index: Dollar Still Remains the Market’s Safe Play
Whether the Pound was strong or the Yen was weak, overall Dollar demand in the market is still stable. Traders are fully focused on the FOMC Meeting Minutes because they will decide whether the USD will strengthen further or see profit booking. In the forex trading market, sentiment currently is that until the Fed gives a soft signal, the Dollar will not easily move to the downside.
Conclusion: How to Trade Forex Today (Quick View)
Today, the market does not show a clear trend but rather news-driven volatility. There is short-term pressure on GBP after CPI 3.0%, but direct selling can be risky; wait for BoE comments. Focus in USD is on FOMC Minutes, so avoid aggressive entries before the release. USD/JPY is near the 159 level, upside here can be risky due to possible BOJ intervention risk. EUR/USD is in range, and scalping may work better. Overall, today’s focus should be on a “wait for news, then trade” strategy, and avoid overtrading without confirmation.
| Note: This content is for educational and informational purposes only. The views given here are not financial advice. Forex trading involves risk, so before taking any trade, do your own research or consult a financial advisor. Responsibility for profit and loss lies solely with the trader. |
|---|

Today’s economic calendar is quite important, especially for CAD and GBP currencies, because the market focus will remain on inflation and employment data. Canada’s CPI m/m data is expected at 0.7%, slightly lower than the previous 0.9%. This means the market is expecting inflation pressure to cool down slightly. However, if the actual figure comes above 0.7%, a strong bullish move could be seen in the Canadian Dollar, because higher inflation may delay future rate cuts. At the same time, Common CPI y/y is also expected at 2.6%, the same as the previous 2.6%, which means the market is seeing a stable inflation trend. Sharp volatility may remain in CAD pairs during the data release time.
On the GBP side, there are also strong chances of movement today. UK Claimant Count Change is expected at 23.1K, while the previous figure was 26.8K. The news about people losing their jobs might get a little better. That is good for the Pound. The Average Earnings Index is expected to be at 3.8 percent, which’s the same as it was before. If people start getting paid more that could cause worries about prices going up and the Bank of England might keep talking which could help the Pound.
For people who trade with the dollar the minutes, from the RBA Monetary Policy Meeting are still very important. This report directly shows how hawkish or dovish the Reserve Bank of Australia is regarding future interest rates. If the minutes contain concerns about inflation and signals of strict policy, buying momentum may come into AUD. Overall, CAD and GBP pairs may remain the most active in the market today, and during news time fast spikes and liquidity grabs may be seen, so trading with proper risk management will remain important.
Central Bank Update
Today the entire market focus remains on central banks and the policy outlook, and honestly, that is also the main reason for volatility in currencies. First of all, a strong warning has come from Japan. Japanese officials have clearly signaled that if excessive weakness in the Yen continues, the government will not hesitate to carry out FX intervention. The market is already closely watching the aggressive rally in USDJPY, so traders should now be ready for sudden reversals and sharp spikes. Japan’s stance directly shows that authorities do not want the currency to weaken uncontrollably.
On the Australia side, the RBA Minutes gave the market quite a hawkish surprise. The report revealed that 8 out of 9 members were in favor of a May rate hike because the risk of rising inflation expectations was concerning them. This update is being considered positive for AUD because it simply means the RBA may still maintain an aggressive stance against inflation. If upcoming inflation data remains strong, further tightening expectations may also build in the future, due to which buying momentum may be seen in AUD pairs.
The US market is also showing mixed sentiment. The banking sector has delivered a solid 13.4% return over the last 6 months, but not every bank appears to be in a strong position. Banks like PB, NBHC, and FRME are showing flat growth numbers and EPS outlooks, because of which investors remain cautious. Along with this, Dominion Energy’s massive $420B AI-driven merger news has become a major discussion topic in the market. Some investors see it as a long-term growth opportunity, while on the other side doubts are also being raised regarding consumer costs and returns. Overall, market sentiment is still revolving around central bank policy, inflation expectations, and risk sentiment, so traders should not ignore news volatility today.
JPY Weakness, GBP Strength & Major Currency Movements
Today, strong movement was seen in the forex market, especially aggressive volatility in JPY pairs. USDJPY was seen trading around the 159.01 level, clearly showing Yen weakness. Not only USDJPY, but GBPJPY was also trading at 213.35 and EURJPY at the strong level of 185.13. Market speculation is that despite Bank of Japan intervention warnings, pressure on the Yen still remains. Because of this, JPY pairs appeared the most active on traders’ radar.
EUR/USD: Stability in Euro, Pressure on Dollar
Today the EUR/USD pair was seen trading around the 1.1641 level, showing stable strength in the Euro. Pressure remains on the Dollar side because traders are now pricing in future Fed rate cut expectations. On the Europe side, the inflation outlook also appears relatively controlled, due to which the Euro is getting support. If the pair sustains above 1.1650, further bullish momentum may build.
GBP/USD: Strong Buying Momentum in Pound
GBP/USD is trading today in the strong 1.3417 zone, clearly indicating buyer dominance. UK Average Earnings data is expected at 3.8%, and unemployment claims are expected to improve from 26.8K to 23.1K, because of which the Pound is getting support. The market believes that the Bank of England will still not take inflation lightly, and this expectation is giving GBP a bullish tone. If momentum continues, further upside movement may be seen in the pair.
USD/JPY: Yen Weakness Still the Main Market Focus
USD/JPY is trading near the critical 159.01 level and has become the hottest pair in the market. Japan has definitely given a warning of FX intervention, but despite that pressure on the Yen still remains. Traders are now closely watching whether Japanese authorities directly intervene in the market or not. Until strong intervention happens, volatility and sharp upside spikes may continue in the pair.
USD Index: Mixed Sentiment in the Dollar Index
Mixed movement was seen today in the USD Index. On one side, weak inflation expectations are keeping the Dollar under pressure, while on the other side safe-haven demand is supporting it. The strength in EUR/USD and GBP/USD is also putting downside pressure on the Dollar Index. Overall, the market is now waiting for central bank commentary and upcoming inflation data, which will decide the Dollar’s next direction.
Geopolitical Market Update Today – Middle East Tensions Keep Forex Market on Edge
USD: Safe-Haven Demand Supporting the Dollar
Today the Dollar was seen trading with a relatively strong tone in the market, and the main reason for this is the ongoing Middle East tensions. Investors currently do not appear to be in the mood to take risks, because of which safe-haven demand is supporting the USD. Due to concerns about oil supply disruptions, crude prices remain elevated, and because of this inflation fears are also building again. The market now understands that it will not be so easy for the Fed to become aggressively dovish. That is why in the short term Dollar downside appears limited, especially if geopolitical tensions escalate further.
EUR: Pressure on Euro from Energy Prices
A slight upside move was definitely seen in EUR/USD, but the pair is still struggling to give a strong bullish breakout. Europe’s biggest problem right now is rising energy costs, because Middle East tensions are directly impacting oil prices. Higher energy prices may weaken the Eurozone growth outlook, and because of this confidence in the Euro appears limited. The market focus will now remain on ECB speakers and geopolitical headlines, but overall sentiment is still cautious. If oil prices spike further, downside pressure on EUR/USD may increase more.
GBP: Recovery in Pound, But Risk Still High
GBP/USD showed some strength during the European session and the pair was seen trading higher, but market confidence is still fragile. UK economic data has remained supportive in recent weeks, but political uncertainty and rising bond yields are keeping investors cautious. Traders will also keep an eye on Bank of England speakers, especially regarding the inflation outlook. But the truth is that Sterling’s direction is currently being decided more by global risk sentiment than domestic data. If Middle East tensions increase further, a fast downside reaction may be seen in GBP.
CAD: Limited Strength in CAD Despite Oil Support
Normally higher oil prices are positive for the Canadian Dollar, but this time CAD is not showing such a strong rally. USD/CAD is trading around recent ranges because the broader market is currently focused on safe-haven Dollar buying. Due to Middle East tensions, crude prices remain elevated, but the FX market is giving more importance to liquidity demand and risk sentiment. Due to a market holiday there might not be many people trading, which could make currency values move a lot and unpredictably.
If theres stress, in the world because of politics the US dollar might get stronger compared to the Canadian dollar for a little while.