


The current dynamics in the world forex market are being influenced by factors such as poor economic performance, movements in central banks, and political instability. Poor economic indicators from countries such as the UK and US, which show slowing growth for the former and poor dollar performance for the latter, are currently contributing to market volatility. Moreover, comments from central banks of Japan and China are influencing the movements of currency pairs such as the JPY. The markets’ sentiment is currently swinging between risk-on and uncertainty.
Daily Forex News Analysis : Market Sentiment, Economic Data & Central Bank Insights
Effects on Economic Data (GBP & USD)
The poor economic performance by the United Kingdom is a clear indicator that the economy is moving into a period of slowdown, exerting pressure on the GBP. In such a case, traders should be looking for possible opportunities to sell off the pair in the market.
The US retail sales figure was below expectations, reflecting weakness in the USD currency. The immediate effect is reflected in the positive movement of pairs such as Gold and EUR/USD. At the same time, there is a risk of a sharp increase in the price due to volatility caused by news events.
Central Bank Update (BOJ, PBOC & Federal Reserve Outlook)
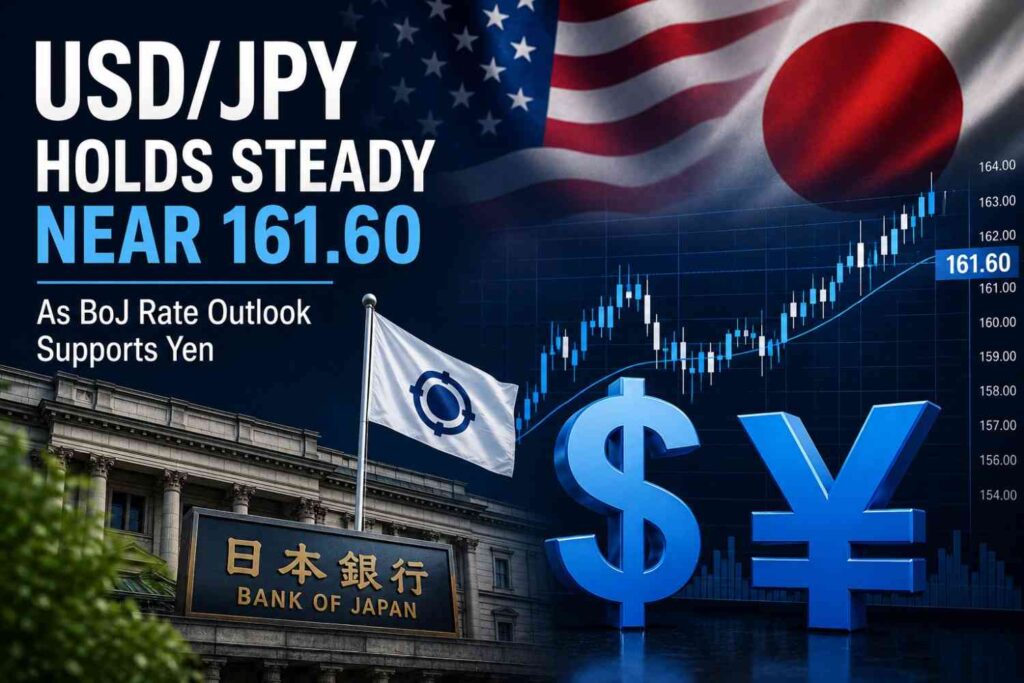
The BOJ policy maker Masu talked about the weakening yen and the impact on inflation, which has heightened expectations of market intervention. Because of this, sudden volatility and sharp intraday moves can be seen in JPY pairs.
China’s strong yuan and the PBOC’s controlled USD/CNY fixing show that Asian currencies are being actively managed, which is putting pressure on USD sentiment. Fed expectations are currently mixed, as the market is waiting for future inflation data, so a clear long-term direction in USD is absent.
Market Movement Analysis (Your Live Data Included)
According to your personal watchlist, the current market structure is showing a very clear picture:
GBPJPY → 213.46
EURJPY → 184.88
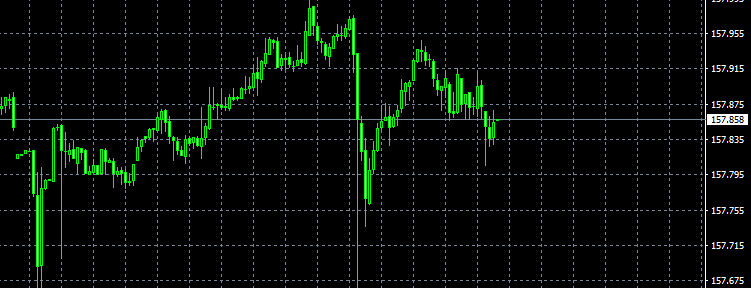
USDJPY → 157.88
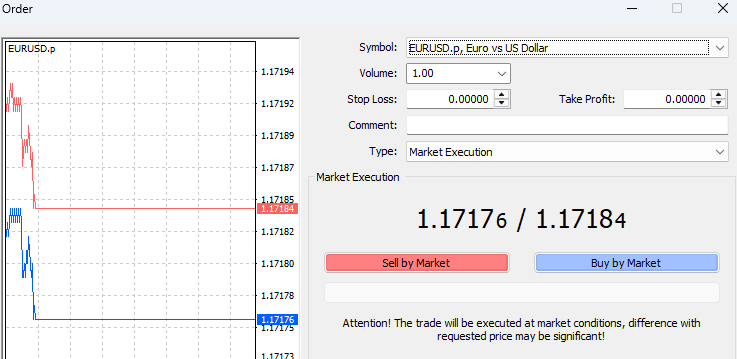
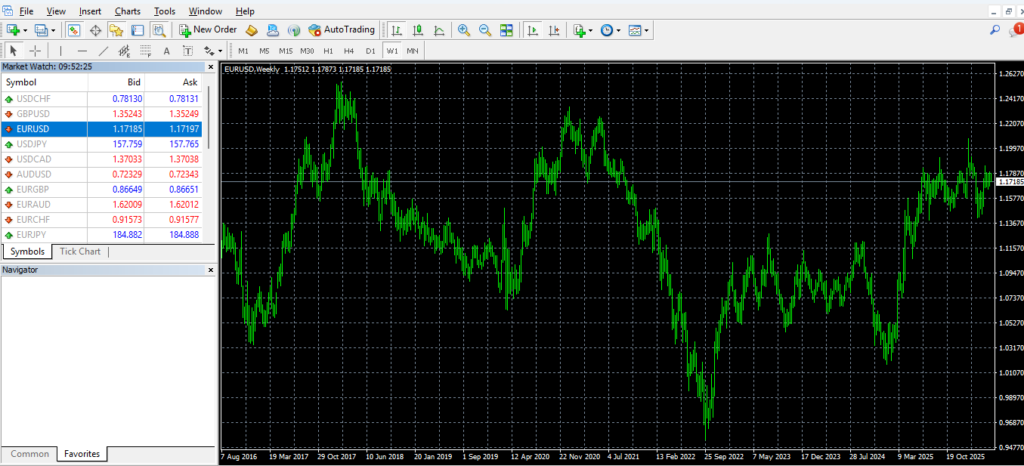
EURUSD → 1.1709
GBPUSD → 1.3520
This data clearly shows that JPY weakness is dominating, because of which GBPJPY, EURJPY, and USDJPY are trading in a strong bullish zone. This confirms a risk-on sentiment where investors are exiting the safe-haven currency (JPY) and shifting into risk currencies.
EURUSD (1.1709) and GBPUSD (1.3520) are in a relatively stable bullish zone, which indicates that the USD is not fully strong right now. USD behavior in the market is mixed, where there is neither strong buying nor strong selling, so a consolidation phase is developing.
Geopolitical News Impact (Global Risk Flow)
US-China trade talks and Iran-related tensions are creating uncertainty in the market. This situation is making overall market sentiment sensitive, because of which sudden spikes and liquidity grabs are being seen.
Middle East tensions are supporting oil prices, which is also affecting inflation expectations. Its direct impact is being seen in the form of bullish sentiment on Gold, while volatility may remain high in USD/CNH and Asian pairs.
Market Sentiment & Upcoming Events
Right now, the market is overall in a mixed but slightly risk-on phase. JPY is weak, GBP and EUR are performing relatively strongly, while USD is currently in an unclear direction.
Upcoming high-impact events (CPI, central bank updates, US data releases) can quickly change market direction. Therefore, the current market can be called a “pre-news volatility zone” where fake breakouts are common.
Final Conclusion (Trading Outlook)
Looking at the overall market structure, it is clear that a strong trend is currently absent, but JPY weakness is the dominant factor, because of which bullish momentum in JPY pairs is continuing. EURUSD and GBPUSD are stable but waiting for a strong directional breakout.
For smart traders, the best approach is to combine their personal levels (like 1.1709 EURUSD, 1.3520 GBPUSD, 213.46 GBPJPY) with market structure and take entries only after confirmation. In a news-driven market, patience and timing create the difference between profit and loss.
The US Dollar is getting stronger because people think the Federal Reserve will raise interest rates. This is happening when there are a lot of problems in the world that make people want to invest in things.
The whole world of money is being very careful because prices are going up in the United States and there are a lot of problems between countries. People who invest money are waiting to see what happens with prices in the United States and what the Federal Reserve will do. They are also putting their money in places like the US Dollar, the Japanese Yen and Gold. The prices of things like oil and food are going up and down because people are worried about getting the things they need and what will happen with interest rates.
How People Feel About The Market
Most people are being very careful and do not want to take a lot of risks. There are problems between the United States and Iran and people are worried that this will cause problems. They are also worried that interest rates will stay high for a time. The US Dollar is still doing well. The money of countries that like to take risks is not doing as well. People are still putting their money in places like Gold and the Japanese Yen.
Looking At How Different Types Of Money Are Doing
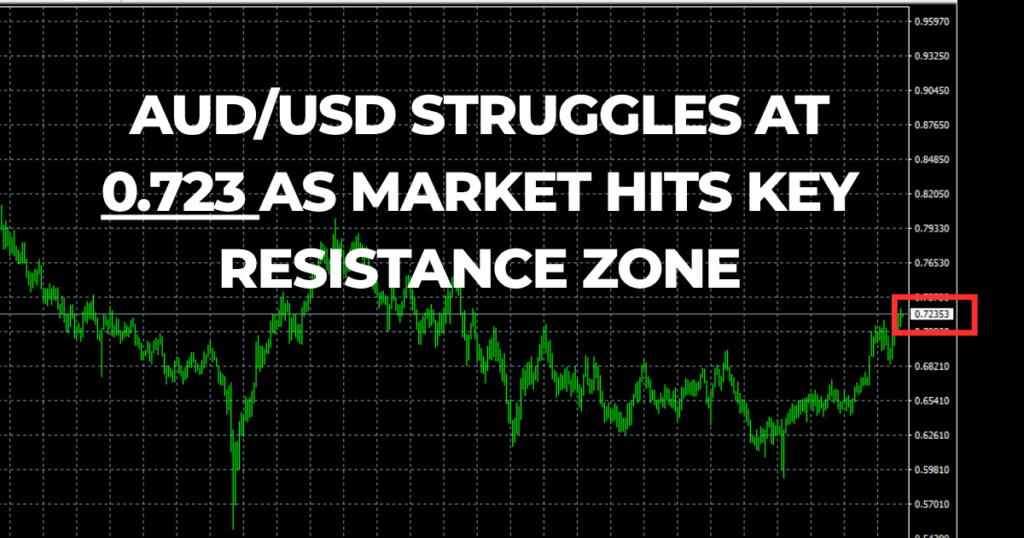
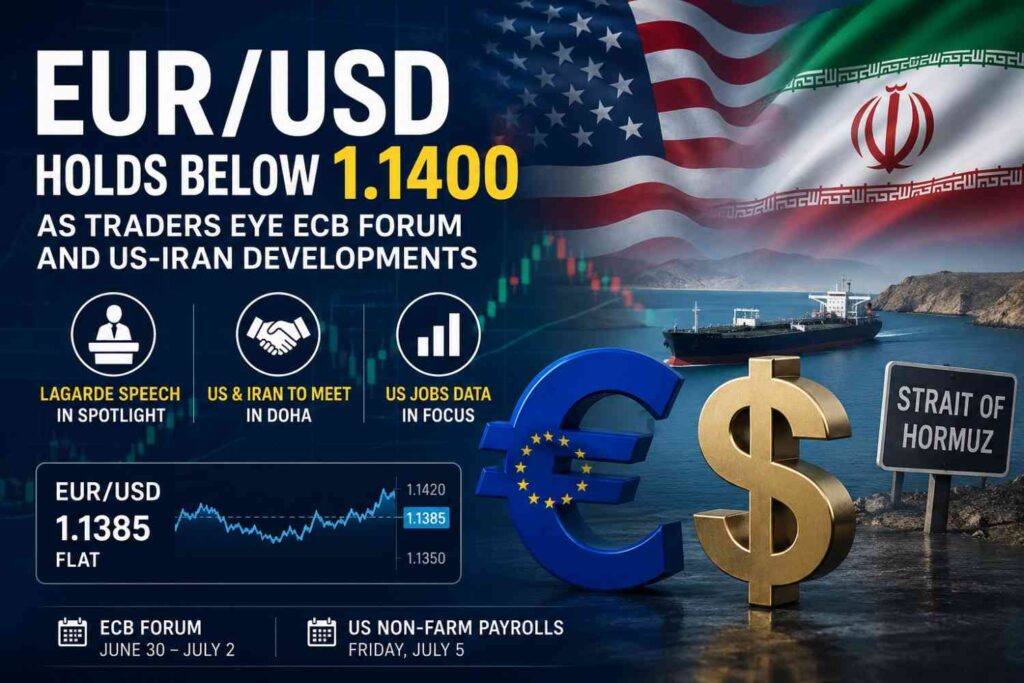
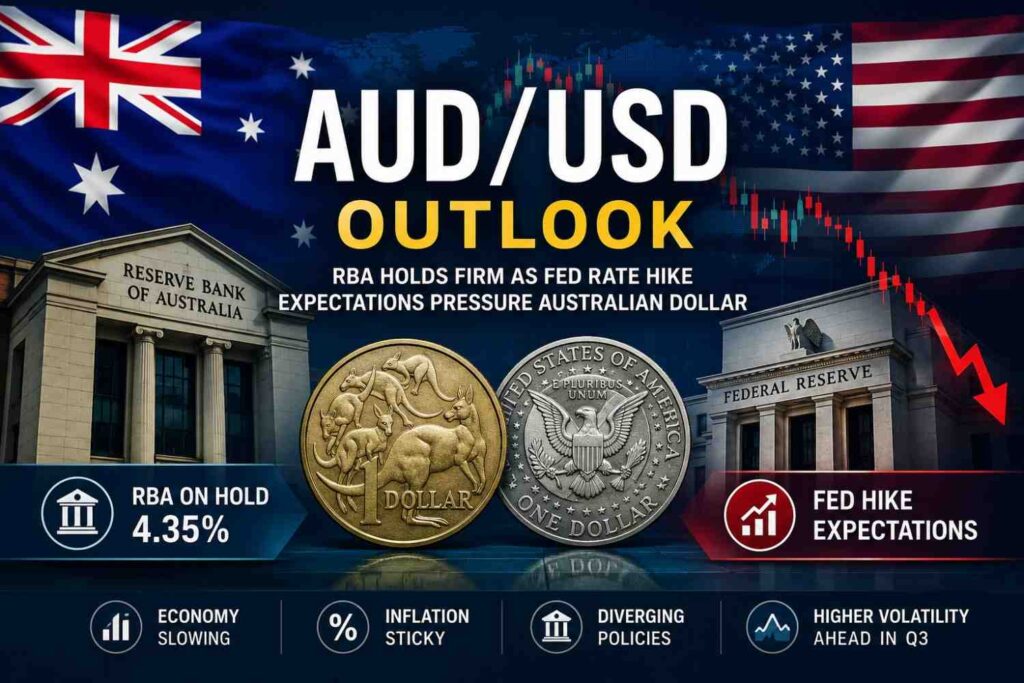
The Euro and the US Dollar are not doing well because the US Dollar is getting stronger. The US Dollar and the Japanese Yen are doing well because people want to put their money in places and the interest rates are good. The Swiss money is staying the same because people are waiting to see what happens with events in the United States. The Australian money is doing okay because the news about wages in Australia was not surprising. The Indian money is doing a little better because India is trying to make its trade better by changing the rules about Gold and Silver.
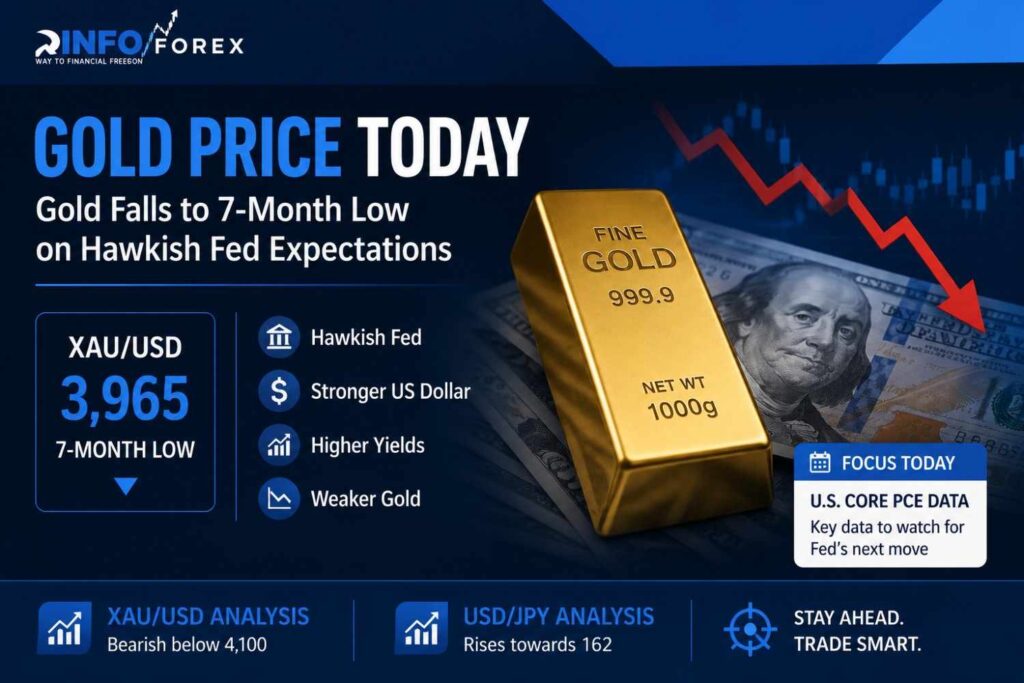
What Will Happen To Gold
Gold is still a place to put money because of all the problems in the world.. The strong US Dollar and high interest rates are making it hard for Gold to go up in value. Even though people are putting their money in Gold they are not sure if it will go up or down. The price of Gold is staying the same. It will probably keep doing that unless something big happens.
What Will Happen To Oil
The price of oil is still high because of problems between countries and worries about getting oil. People are worried that there will not be oil and that is making the price go up.. The strong US Dollar is making it hard for the price to go up even more. The price will probably stay high. It will not go up too much unless something big happens.
Important Events
People are waiting to see what happens with prices in the United States, which will help them know what the Federal Reserve will do with interest rates. If prices are higher than expected the US Dollar will get even stronger. That will make the markets more volatile. There are also discussions about who will be in charge of the Federal Reserve and that is making people unsure. The news about wages in Australia was not surprising so it did not affect the markets much.
Good Times To Invest
It might be a time to invest in the US Dollar if prices are higher than expected. It might be a time to sell the Euro and the US Dollar when they are high. It might be a time to invest in Gold when there are big problems in the world. It might be a time to invest in the Swiss money and the Australian money when they are not moving much. It might be a time to invest in oil when there is news about problems in the Middle East.
Important Numbers
The Euro and the US Dollar will have trouble going up if they are between 1.1700 and 1.1750. They will be safe if they are near 1.1600. The US Dollar and the Japanese Yen are doing well. They will keep going up. Gold will have trouble going up if it is near its high price. It will be safe if it is near its price. The Swiss money is safe if it is above 0.7800. The price of oil will be volatile. It will be safe if it is near the price that people are willing to pay because of problems in the world.
Warning
The markets are very volatile because of problems in the world and changes, in interest rates. Things can happen that are not expected. That can make prices go up and down quickly. People who invest should be careful. Not take too many risks. They should use stop-loss levels. Not borrow too much money to invest.